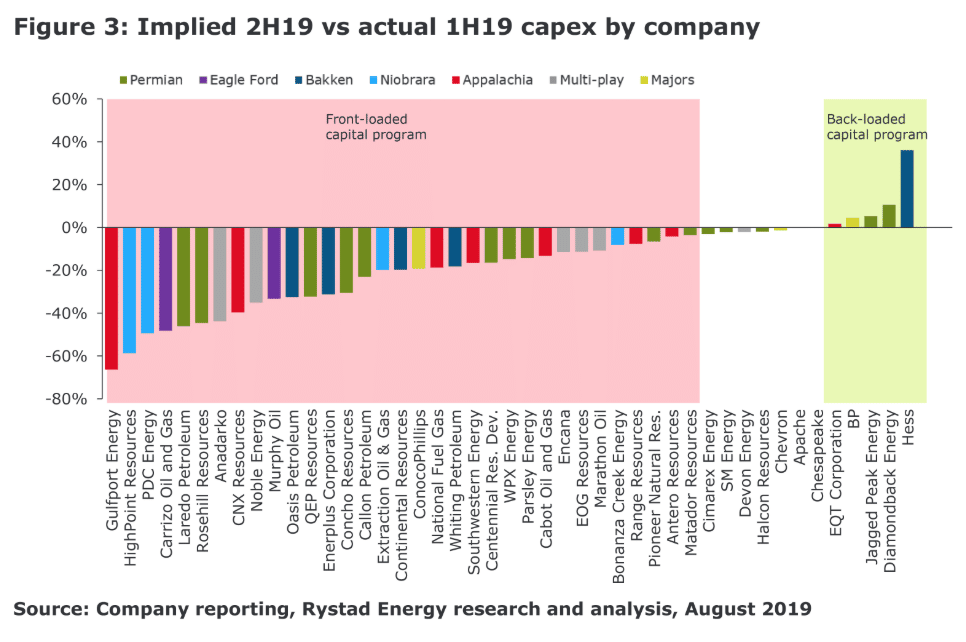
In a newsletter article from back in August from Rystad Energy titled “US Shale Operators Manage to Raise Targets yet Stay Thrifty”1, they take a look back at 2Q19 and look at the shift from the beginning of the years front-heavy capex spending to how production has influenced capex changes for Q3 and Q4. The group of analyst determined that because of the second half of 2019 will be carried by production volumes and lower costs to drive cash flow, they found that most of the operators had an unchanged capital budget or a slight reduction in capex spending. The prominent outlier in the trend is ConocoPhillips, who are adding a rig to their Eagle Ford fleet and increasing capex spending in the basin to add $100M in 3Q19. Nonetheless, the direction of the industry according to Rystad data is the decrease in spending for the second half of the year, where the largest cuts appear to be made by pure-play operators, with the highest density of cuts centered around the Permian.
In this week’s article, we are looking at the trends from this summer and looking at how they panned out during the fall. There is a fine line when production is at record highs and investors are calling for capital discipline that results in a better return. We will draw conclusions from public reports to shape an outline of 3Q19 and the remainder of the year, as well as projections as to the beginning of the year, trade tensions, and the competition for market share.
One notable chart from the Rystad report is the comparison of budget cuts from actual spending in the first half of the year overlaid with the implied expectation of the second half.
From what we know about which operators make up their contribution to the overall production number, and excluding operators that have had issues with takeaway capacity constraints, we will focus this analysis on the majors, larger producers, and those that are nearly split on capital cost throughout the midpoint of the year or have more of a back-loaded capex plan. Regardless of when each operator decided to execute their 2019 plan, most of which are on track to meet discretionary goals set this time last year and maintain, or grow free cash flows. An anomaly of the group, as we found, Halcon Resources did file for chapter 11 around the same time that this report was published by Rystad which might add some color to their ‘straight-line’ path story with all else held constant on 2019 capex programs.
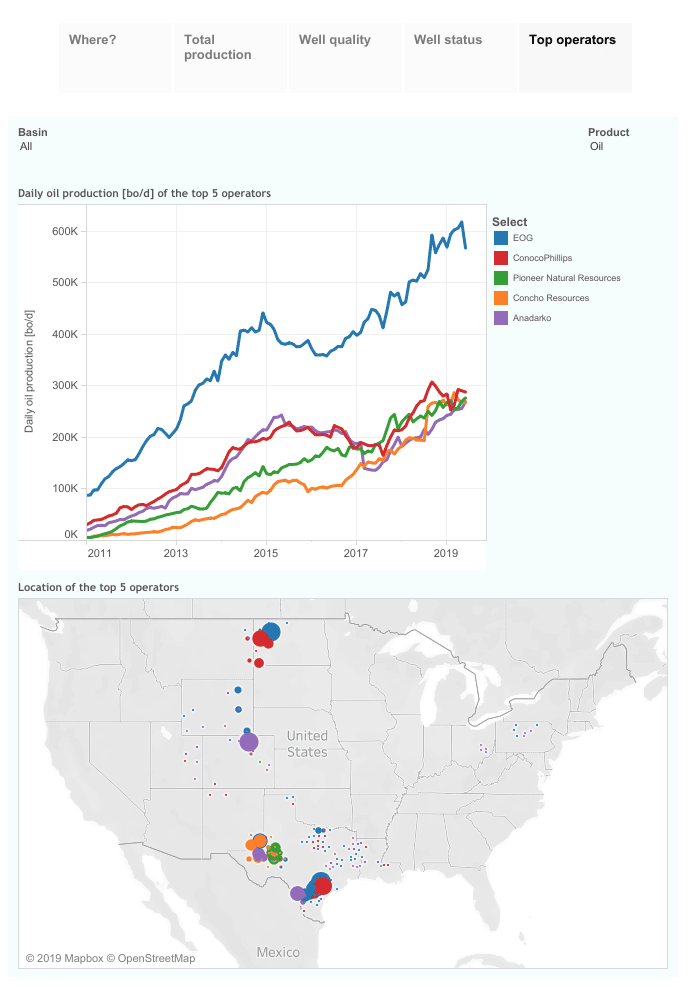
As of June of this year, ShaleProfile has listed the top 5 producers in the US of crude oil are EOG, COP, Pioneer, Concho, and Anadarko2. In order of capex already spent, Anadarko leads the group in capex spent while producing the least amount per day (269,183 b/d from 3,619 active wells). We know, however, that Oxy closed on Anadarko August 8th, also around the same time as this report, which could have impacted their capex spending as the the deal value closed in on $38B. Comparatively speaking, Anadarko’s next closest peer in as a non-major multi-basin operator, EOG, has spent about one-third of the capex for the year and is the leading oil producer in the US adding 567,777 b/d of production from 6,855 active wells. On a per well basis, Anadarko produces about 85 b/d while EOG produces 83 b/d.
Interestingly, ConocoPhillips lower 48 onshore production is largely outside of the Permian basin, as is EOG, and they hold the silver and gold metals for June 2019 production respectively. COP stood head and shoulders above the crowd by adding that additional $100M in capex after picking up the Eagle Ford rig, where almost every other operator except for a major and a few very large oil and gas producers added to the spending and continued working deep into the calendar year. COP also leads the charge in productivity averaging 122 boe/d from 2,353 wells and a cumulative daily production of 288,267 b/d overall.
Now that we have some landscape work taken care of, let’s look at how this applies to automating the completions operations subset to produce measurable, investable savings.
Looking at the August Investor report from COP3, they are in line with what most shale operators have dissented upon during the ‘awakening’ phase of the shale boom from 2014 to the present – higher density sand per foot and increasing the number of clusters was an easy way to scale until it became imperative to pair the sand concentration design with each individual stage. Conoco claims to have seen a roughly 30% increase in production from 2012 to 2017-current in a series of 4 iterations of completion design changes.
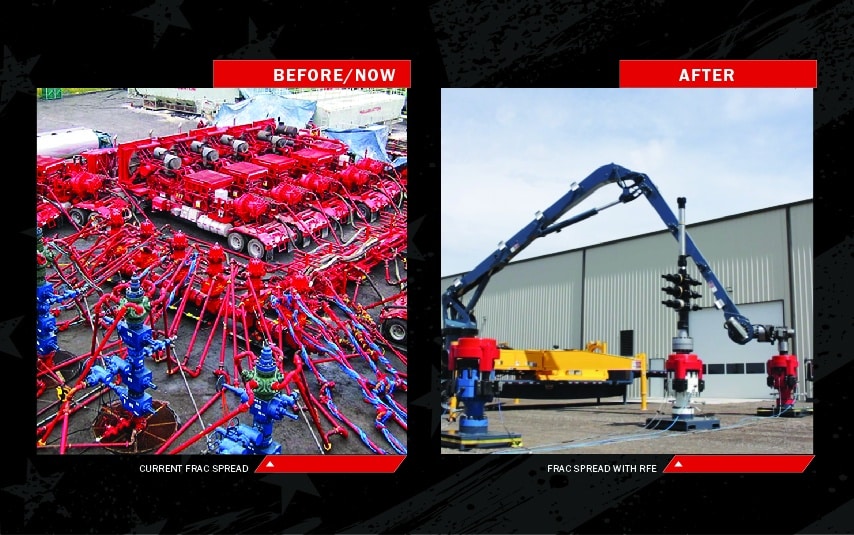
Now, as cheerleaders for operators realizing their potential for surface efficiency gains in addition to production and financial growth, their lower 48 operations are absolutely ripe for adopting completion hardware automation technology that can safely bring on more wells in any given year solely from Automated Frac Equipment™ (AFE™) among other products and services we offer.
Again, glaring example is Conoco picking up an additional Eagle Ford rig for 3Q19 and 4Q19. Armed with the ability to produce a handful more pads by year end could be a healthy cushion to boost cash from operations (CFO) and create additional CFO to continue to grow the company while affordably paying dividends, share buybacks, and overall smoothing out the cyclical nature of the business. Within reasonable expectations, 2020 is poised to be a high production year with plenty of takeaway capacity flooding the global market with supply. An advantageous way to infill a program with new D&C wells or bring DUC wells online in a more rapid fashion, AFE™ can deliver foundational efficiency simply through quick toggle times between operations resulting in 3-5 more stages per day in a safer way than current methods. We think this could be its own line item next year on the 3Q2020 version of the “Continuous Learning and Optimization of Completions Drives Value” slide! COP is scheduled to issue a third quarter update on October 29th, we will come back to them in a few weeks.
Circling back to EOG. This group boasts a decentralized, non-bureaucratic, and most importantly, innovative and entrepreneurial group where the value each team member as a business person first. Like others, low cost, self-sourcing, and execution is the name of the game of disciplined results and returns. In their 2Q19 update they list the following IT components that drive their company into a highly organic growth machine and exemplify the following as pillars to their success: real-time data capture, large proprietary data warehouses, predictive analytics, 100+ in-house apps, and fast/continuous technology advancement4. Honestly, it’s not every day you see that much detail (and it isn’t even that much) on what technology means to them printed in an update. For the Permian-centered Wolfcamp stack, has seen an 8% increase in 1H19 completed lateral feet per day, doing from 1,030 feet per day to 1,110 feet per day, and a subsequent 12% increase in 90-day cumulative production in this interval from all of 2018 (normalized from 7,000ft laterals). Technology-driven operator, meet a technology driven service provider. In their entire US portfolio of assets, EOG is scheduled to complete approximately 725 wells in 2019. You don’t have to be data driven to fathom the mountain of moving parts to make this single metric happen.
We say – eliminate some of them. 85% of all the dumb iron can be eliminated with AFE™, and 30 minute rig up times are the new reality – no mini-cranes or one-dimensional equipment here. Switch from wireline to frac in minutes with RigLock®. Machine operated wireline handling & rebuilding rather than by hand with GunHandler™. Smart equipment to match the mentality of data driven operators of scale. We challenge you to see the difference optimizing surface operations can have on your production by being able to orchestrate your mobile outdoor factory in a calibrated, automated fashion.
Looking at the gas production end of the spectrum, the Rice-EQT merger followed by the successful proxy battle led by the stiff arm of the Rice brothers to take control of EQT and implement some serious changes in an effort to create a real synergy with a bandolier of robust assets. 8 new board members, a 100-day plan, and a well stoked fire is sweet music to our ears6. Having said that, we realize that since the time of the last investor update the 100 days is nearly up. Better late than never right? The core of our business is consolidating, digitizing, and automating overlooked oilfield equipment and processes. There is no better way to optimizations than by removing manual human labor and old fashioned iron with remote controlled, multi-axis and programmable stinger coupled between the missile and wellhead. When well intervention is needed or backside casing pressure requires attention, we have a suite of simpler, faster technologies that frankly do not exist elsewhere and at a fractional cost to what is out there. In addition to high-bleed pneumatic replacement, consider our Casing Expansion Tool (CET™).
We know there are plenty more of you operators out there doing incredible things for our industry, its investors, and the surrounding communities and environment. As we get to a place where capacity comes online to significantly increase our overall production, the battle for top spot in production for both oil and gas will result in being up to our eyeballs in gross production, keeping prices and sustainability fragile in the face of volatility. As renewables are steadily gaining market share as energy producers, it ultimately puts pressure on our sector to continually keep costs low and responsibly manage assets for the long term. While renewables simply can’t replace the impenetrable value oil & gas provides to everyday life, it can keep us honest and stay on track to be able to keep developing this vital resource and minimize political backlash and division. We strongly believe our technologies systematically fit into the digital transformation we are witnessing in the shale revolution today. In order to hit goals over the long term, operationally, financially, and responsibly, we don’t foresee any possible outcomes where our equipment and services aren’t utilized short of the industry coming to a grinding halt.
Shed some of that weight onto us. Let us help facilitate change within your organization. We as much as any market participants want to see this industry succeed in all the right ways. We are here as a resource to anyone who can see our value that you yourselves say you continually seek. Don’t let 2020 completion plans off the hook too soon – you can take a lot of slack out of the line with technology-driven completion equipment.
-Renegade Services
Sources
- https://www.rystadenergy.com/newsevents/news/newsletters/UsArchive/shale-newsletter-aug-2019
- https://shaleprofile.com/2019/10/08/us-update-through-june-2019
- https://static.conocophillips.com/files/resources/2019-investor-update-08012019.pdf
- https://investors.eogresources.com/Cache/1001255228.PDF?O=PDF&T=&Y=&D=&FID=1001255228&iid=4075407
- https://www.wyomingnews.com/news/local_news/wyoming-cheyenne-continue-steady-economic-growth/article_0e69b3a5-c488-5624-bf97-50c96c794837.html
- https://s24.q4cdn.com/922296017/files/doc_presentations/EQT_Analyst_Presentation_-_July_25_2019.pdf
DISCLAIMER: Renegade Services remains a neutral-party to all of other companies referenced in any blog post listed on our website. The opinions in any blog post do not necessarily reflect the views, opinions, or position of Renegade Services at any point beyond our current time of publishing.
For more information, call us now on 281-603-9720 or use the form below:
Contact form submission from fraclock.com
