It’s that time of year again. Budget season has started to wind down as we head into October. Frac crews are starting to get released as we cut from the year highs back in April of 482 active spreads to now around 395. Although around one-third of the total domestic count is located in and around the Permian basin, it was estimated that about 25 spreads were released this week1. Even with more crude oil long-haul lines coming online in West Texas headed for the Gulf of Mexico at the end of this year and into 2020, an end-of-year annual slowdown will be met with highly anticipated shipping commitments of operators that have not yet fully opened the floodgates. Furthermore, a year end shift in Caribbean refining capacity to supply to the east coast ongoing supply constraints is the light at the end of the tunnel for the upstream holiday siesta2
In Part 1 of this blog series, we are taking advantage of this time to look back at how the industry fared in 2019 thus far. Growing pains for technology adoption in US completions have sparked an on-going debate about whether or not some design changes add efficiency & production gains, or simply additional costs with no production enhancements to offset the effort and dollars required to make juice worth the squeeze.
We will show how we derive a dataset from aerial images and compare with the timeline of filing data to get a sense of time between the start and end times of drilling and completions. Also from our set of data, we can make accurate estimations on beneficiaries of efficiency-based surface equipment that could be a driving factor in time and cost savings when things pick back up again. Other data pulled for this analysis are from the Texas RRC3, FracFocus4, WellDatabase5, and the EIA6. The satellite images and coordinate derivation is from Bird.i7.
Permian – The Pulse of US Production Growth
The drastic growth in US oil and gas production has been a result of the industry focus shifting toward the low cost Permian basin after the downturn. In fact, over half of the US Production is sourced from the Permian8. With the high levels of production, the Permian also now produces and flares more gas than the daily residential gas consumption demand9. caused largely by the lack of sustained takeaway capacity, including gathering infrastructure.
Large operators have since dominated the basin and the ability to produce at lower commodity prices and commit to long-haul takeaway contracts. While they await infrastructure, the DUC well count has continued to grow over the years and the spread between drilling and completing wells can often be delayed depending on pricing, availability of crews, materials, equipment, etc. With the newly minted infrastructure, however, comes the burden to fulfill their capacity contract. In theory, as drilling rigs continue to build efficiency and produce the same amount of new wells with a decreasing fleet of rigs, this could be the eve of a the DUC well inventory to start to show a sharper decline.
To keep production constant, we believe that the cycle times between operations, services, and drilling locations will see continued attention to detail, helping both the operational side of the business as well as the financial side. We are confident that the market will see our offerings as a cost-effective, value-adding, and time-saving bundle that can help them stand apart from the producer pack.
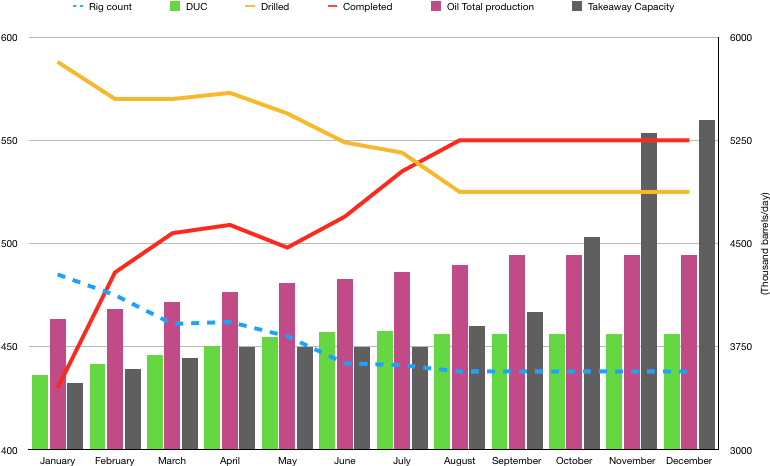
Figure 1. 2019 Permian Drilling, Completion, and Production Trends. Source: EIA Data, Texas RRC, and WellDatabase
Ahead of the Curve (From Above)
As a service provider focused on continually improving, our goal is to facilitate the transition to operational drivers through the adoption of technology. Delivering best-in-class equipment and services that consolidate legacy standard operating procedures into a turnkey package is something we think adds true value during this interval of growing pains.
Nonetheless, we also like keeping an eye on what’s going on around town (go figure!). Just as operators look for an edge and take the latest and greatest tools of the trade out for a spin, Renegade Services gets the keys every now and then as well. Gone are the days of getting coffee at Anytown Oilfield, USA diner and you come away with a tally book full of fresh leads on XYZ operator is doing next (or NOT doing in the coming months). The tools of the trade are becoming much more advanced, to where they are in-fact, ‘out-of-this-world’.
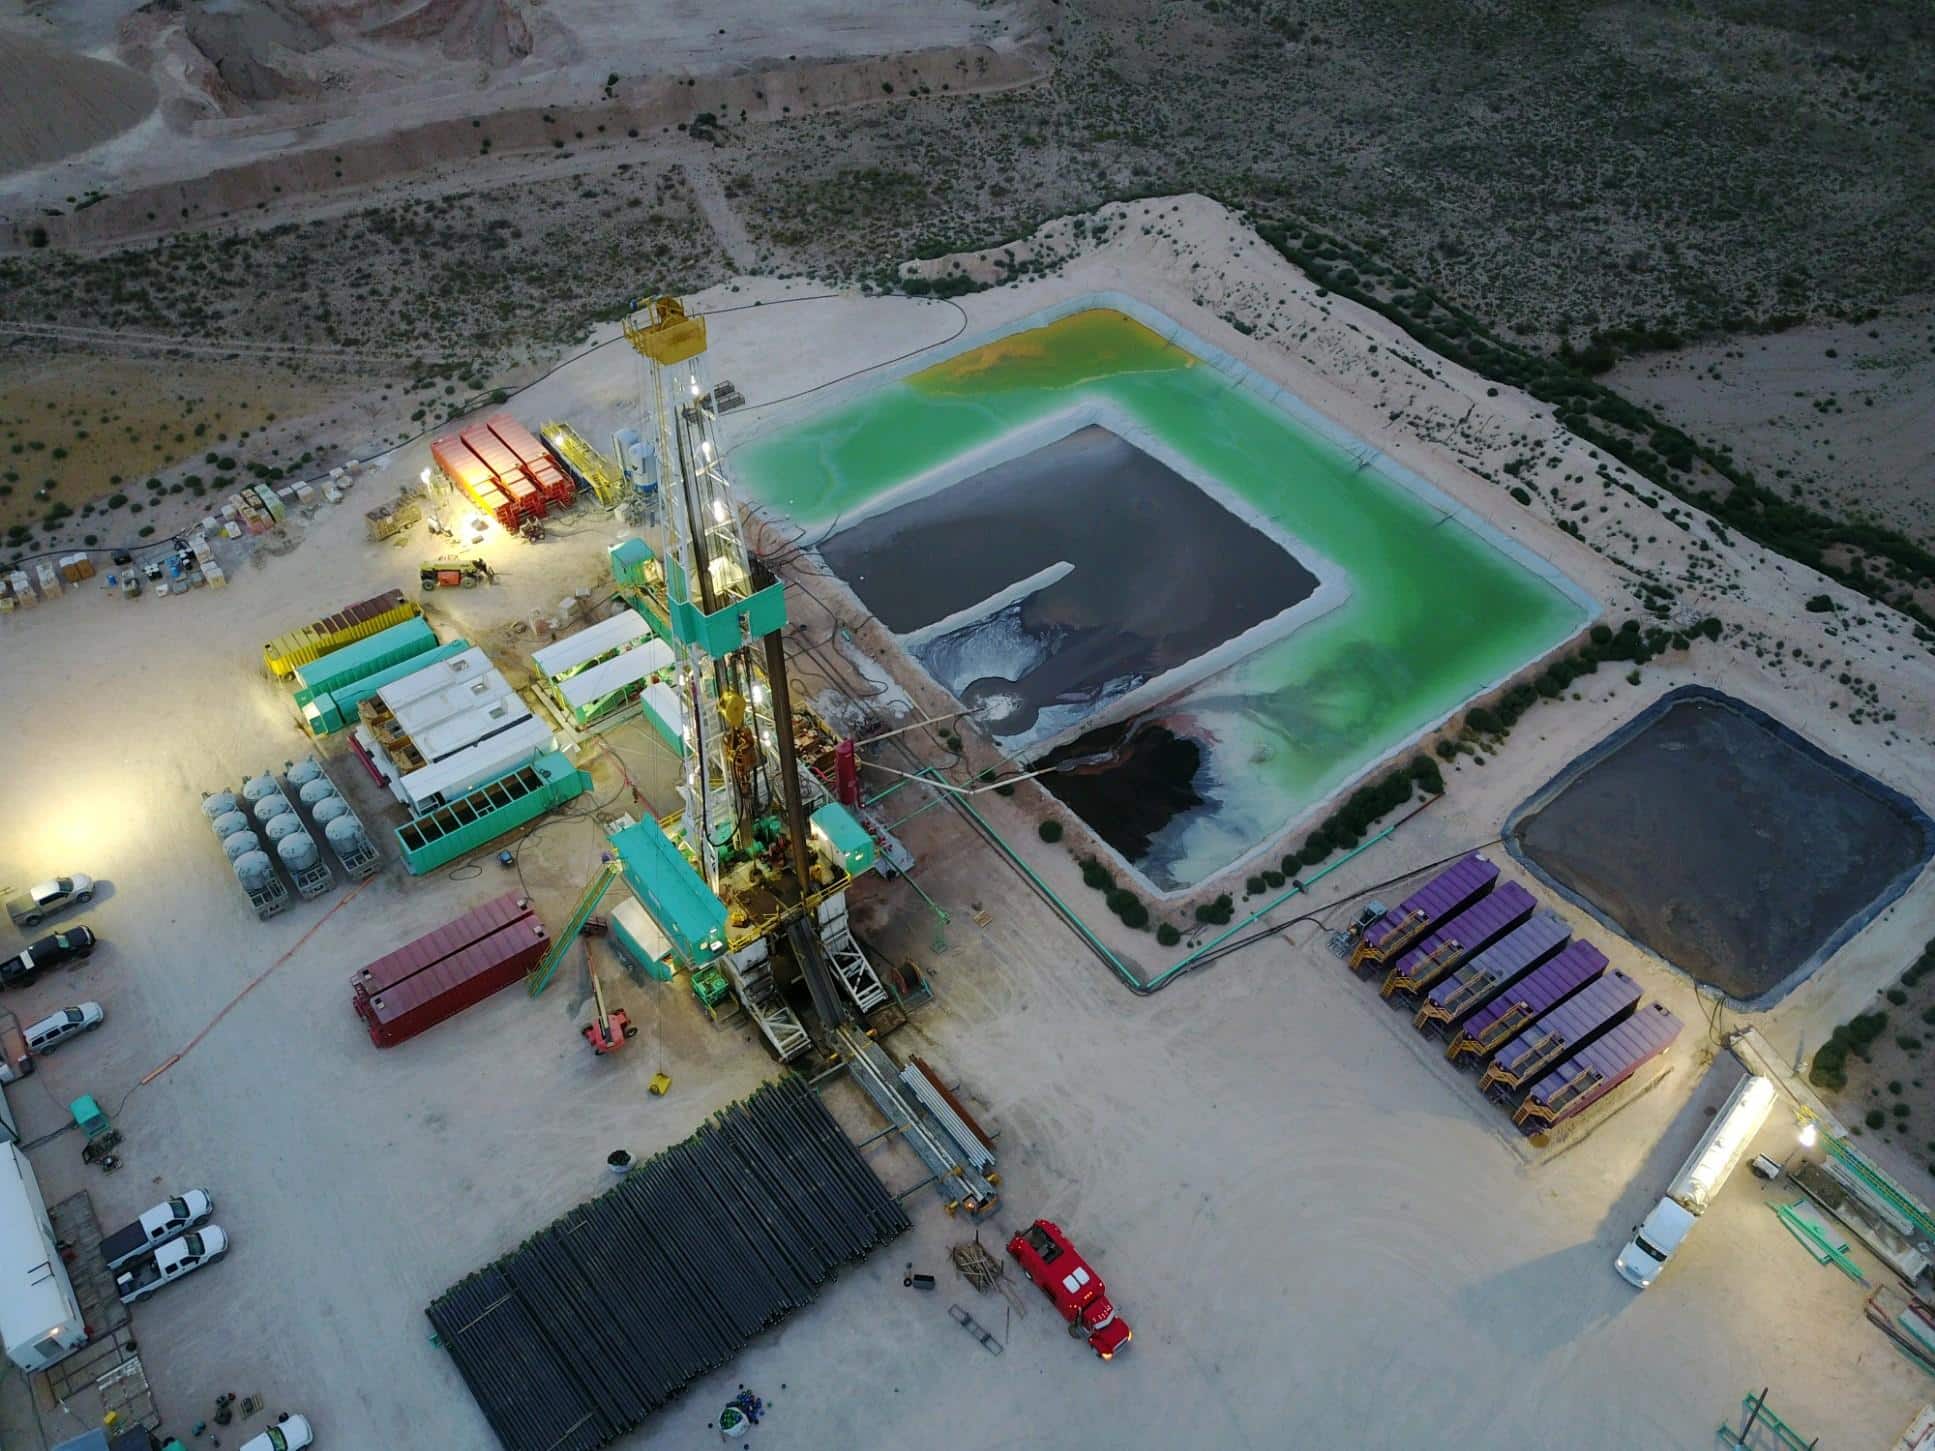
Having these extra resources is inherently valuable. Taking a look into satellite images from Google Earth is often helpful for navigating lease roads in West Texas, but not necessarily helpful in the latest activity. More often than not, images and subsequent data from readily available geographical software can be more than multiple years old depending on your area of focus. Imagine using some of these thinking you’re capitalizing on a new idea (cue Homer Simpson annoyed grunt sounds, aka “D’oh!”).
Scanning for pad development, frac ponds construction, lease roads, staging areas, and pipeline construction to name a few of the attributes we search for to anticipate upcoming activity and better service operators in the area. In the image below taken from earlier this month, current activity in the area shows serious signs of life compared to its standard Google Earth predecessor. It is also noteworthy to look at the surrounding activity of work that has been completed a few months prior. Going back and evaluating surrounding infrastructure after initial production rates have been published can often give a much clearer picture of activity in the immediate and local areas.
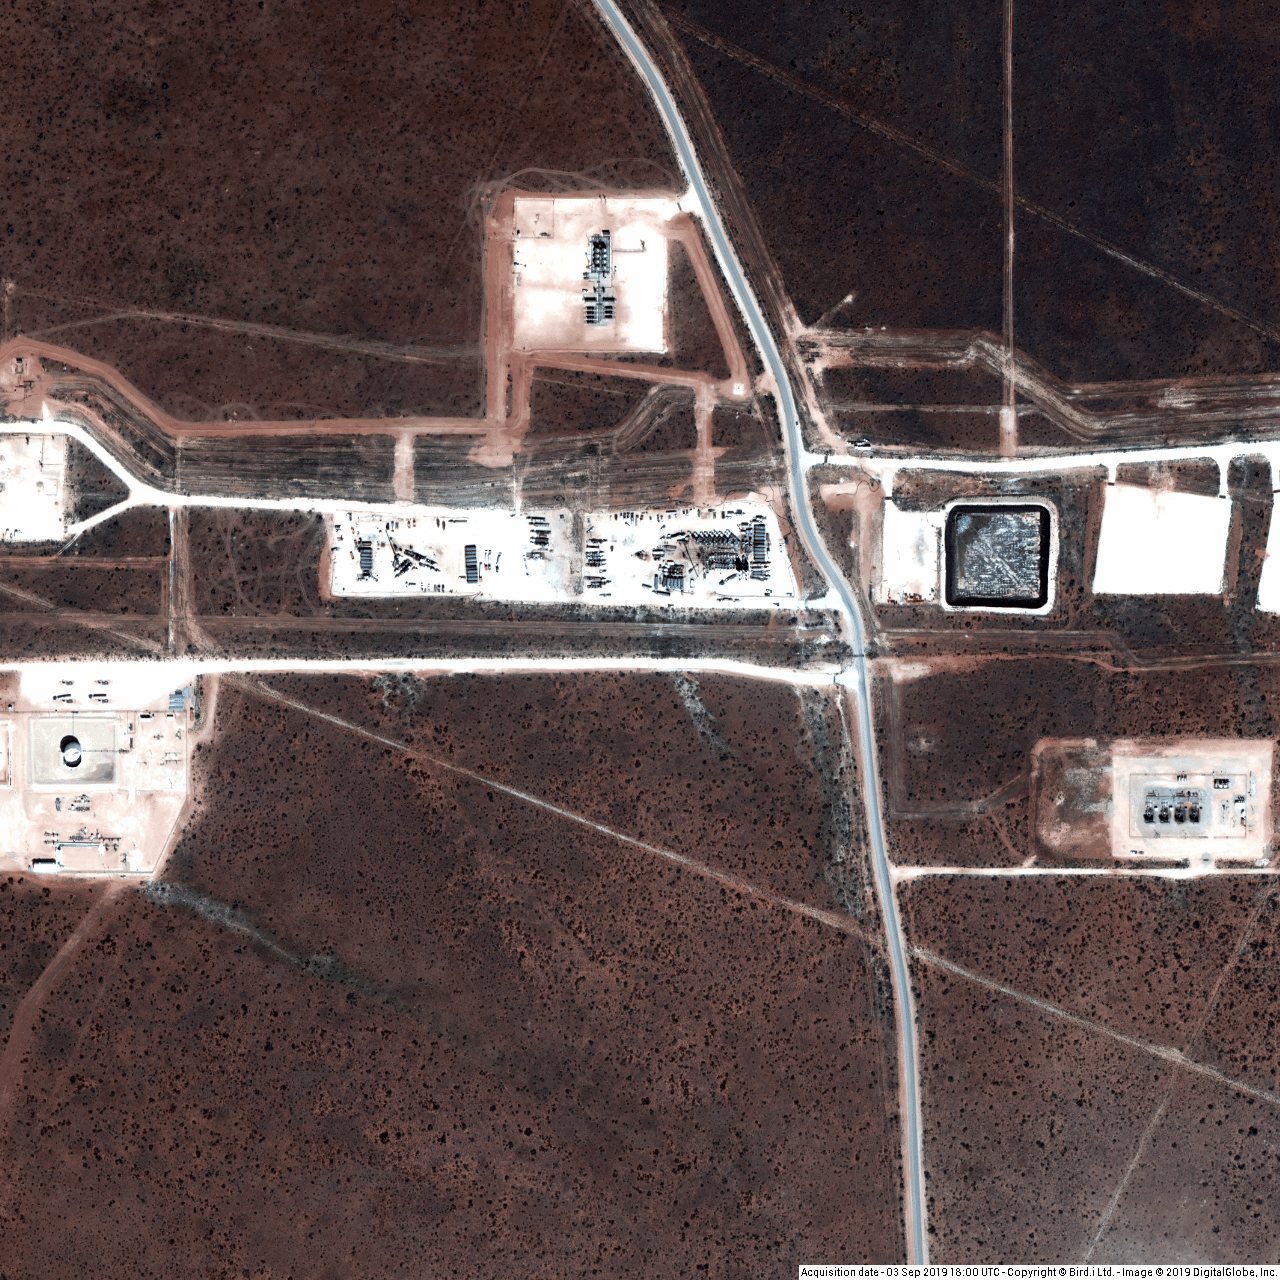
Figure 2. An early September peek into an active frac fleet in the Delaware Basin. Source: Bird.i.
Actionable Real-Time Monitoring
History has shown us that it’s much more likely that the second mouse gets the cheese. We are not the pioneers of this technology and we are certainly not the first in the industry to attempt to wrangle this niche and use it to our advantage. Following in the footsteps of operators that use this tool to keep an eye on their neighbors and the overall basin, weekly or sometimes daily uploads of photos are extremely valuable in reasonably monitoring real-time progress.
Being able to track the latest operator moves, however, can be done without having to wait on weekly team meetings and investor reports to be posted. Utilizing filings as cross-references as leading and lagging indicators, tracking progress directly in the field enables us to grow as our clients, (and potential client) do.
Extremely small teams can make research efforts take a matter of hours when it used to take weeks for entire teams to comb, digest, and analyze geospatial data into something more user-friendly. Being a proactive service company frees up our team to focusing more on innovation and efficiency on the well site, and less on project timing.
Conclusions
Keeping up with the Jones’s is a real thing in today’s technology world. On one hand, it seems like the oilfield is catching up to tech innovations like a post-thanksgiving half-marathon. On the other hand, those embracing the change appear to be making more risk-adjusted decisions that seamlessly mesh and enable faster growth. Building algorithms using existing transformative datasets that can free up capacity within our operational teams is huge for us, and our customers.
The trade off from efforts put into developing this technology is certain to streamline leads, and keep shop teams privy to anticipating the next dispatch. We are excited to see how this helps facilitate growth as we finish up 2019 and start into 2020.
Stay tuned for Part 2 of the series where we map out a detailed series of time-based change on areas of interest and monitor change from a distance.
Sources
- https://blogs.pvmic.com/tag/frac-spread-count/
- https://rbnenergy.com/welcome-to-the-jungle-part-2-limetree-bay-restart-can-help-east-coast-product-balance
- https://rrc.texas.gov/oil-and-gas/research-and-statistics/drilling-information/monthly-drilling-completion-and-plugging-summaries/
- https://fracfocus.org/
- https://app.welldatabase.com/Browse/Wells
- www.eia.gov
- https://portal.hibirdi.com/#/imageservice
- https://www.eia.gov/petroleum/drilling/#tabs-summary-2
- https://www.bloomberg.com/news/articles/2019-04-10/permian-basin-is-flaring-more-gas-than-texas-residents-use-daily
DISCLAIMER: Renegade Services remains a neutral-party to all of other companies referenced in any blog post listed on our website. The opinions in any blog post do not necessarily reflect the views, opinions, or position of Renegade Services at any point beyond our current time of publishing.
For more information, call us now on 281-603-9720 or use the form below:
Contact form submission from fraclock.com